Investors scouring the new opportunity zone map for potential deals will likely find more targets in suburbs, secondary cities and rural areas than in the major urban cores that typically draw the most development dollars.
The opportunity zone 2.0 map released last week is smaller than the program’s first iteration, with 6,576 census tracts compared to 8,764, but it includes a wide swath of uncharted territory for OZ investors: A new analysis found roughly two-thirds of census tracts in the new map weren’t part of the original program.
At the same time, many OZ 1.0 communities lost their designations, with 481 counties falling off the map entirely, according to an analysis from FBT Gibbons Managing Director Frances Kern Mennone, who has been closely tracking the OZ 2.0 process.
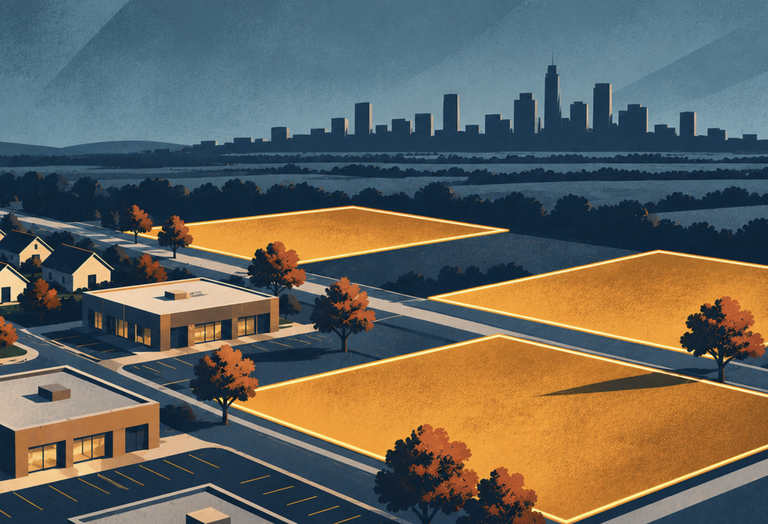
The new map sets up a scramble for deals. OZ 1.0 drew more than $110B, with much of the institutional money concentrated in big-city cores. Fund managers are now raising billions for Round 2, and that capital will be chasing 25% fewer zones. Core-city tracts are scarce on the new map, which should make them more valuable to sponsors with urban pipelines and push more deal flow to metro edges and secondary markets that saw little OZ capital the first time, according to Kern Mennone’s analysis.
The federal government made rural investment a priority, offering greater incentives in those areas, and the map appears to have shifted as a result: According to Economic Innovation Group's analysis, rural zones make up around 39% of the designated tracts, up from 37% in OZ 1.0.
With the new map in place, state and local officials now need to move from the designation process to marketing OZ development sites to investors. The smaller number of zones is expected to bring more competition for attractive sites.
"What this does effectively is it narrows the scope and really dedicates it more toward what its intent is, and that is community development," Novogradac partner Brent Parker said. "You have to be a little bit more selective."
An estimated $112B was invested in OZ 1.0 through the end of 2024, according to the Treasury Department, and 77% of the qualified census tracts have received some form of investment.
Ackman-Ziff Managing Director Andrew Rudy says he thinks the investment volume for OZ 2.0 could more than double the first iteration's total over the next decade. He said he sees institutional investment firms with qualified opportunity funds that have deployed capital into areas “that wouldn’t have access to that capital otherwise.”
Rudy said his team was at Novogradac's Opportunity Zone Conference late last month in D.C., where they tracked more than $6B in capital being raised by the largest institutional allocators over the next 12 to 24 months.
"We’re super excited about the capital formation that’s happening," Rudy said.
The mapping process for OZ 2.0 began this summer, after the One Big Beautiful Bill Act made the program permanent in July 2025. The new program now requires governors of all 50 states and the five permanently inhabited territories, plus the mayor of D.C., to designate new zones every 10 years.
Governors began the process in July, with a final deadline of Oct. 28 to submit their nominations. The Treasury Department then certified the nominations and released the map last week, and OZ 2.0 goes into effect Jan. 1. The program is intended to steer investment toward lower-income communities, offering tax incentives to investors that deploy money into real estate projects or businesses in those areas.
"Across the board, designated tracts are significantly more distressed than the typical community nationally, registering with poverty rates more than double the national average, significantly lower educational attainment rates, and significantly greater vacancy problems," the EIG report stated.
More Rural Zones With Better Incentives
Due to OZ 2.0’s greater incentives for rural zones, and its tighter income requirements for eligibility, opportunity zone experts initially expected the new maps to have a much higher share of rural zones than the first iteration.
However, OpportunityZones.com CEO Jimmy Atkinson's Oct. 6 analysis of the first 12 state maps — including Texas and Massachusetts — found that the share of rural areas was significantly lower than in OZ 1.0.
But after the full slate of maps was released, new analysis shows that the national average ticked up slightly.
"That's a healthy share, considering that investment generally doesn't target rural areas," Parker said. "Rural is going to get a lot of attention."
While the national average ticked up 2 percentage points, a state-by-state breakdown shows a mixed picture: 23 states and territories raised their share of rural zones, while 26 lowered them and seven were unchanged.
The states where the rural share fell the most were Texas, Colorado, Iowa, Kansas, Michigan and Kentucky, according to Kern Mennone's analysis. She found that the rural share rose the most in Nevada, Puerto Rico, Missouri, New York, Ohio and Tennessee.
"The assumption had been from the industry that there was going to be a hard lean towards rural, at least more than what we saw," Kern Mennone said. "It's just interesting that we didn't see that."
While the opportunity zone 2.0 designation process gave states the ability to apply lessons learned from the first iteration, the methods they used to craft these maps varied widely. Some states solicited public input and spoke with localities and developers about the program, while others used less community engagement and focused on the areas where they see the best investment opportunities.
Kern Mennone said this may explain why many states have a lower share of rural opportunity zones this time around.
"A tract is not going to get selected unless it's nominated," Kern Mennone said. "If you're out in a rural area and you've not heard about the OZ program, or your state's doing a bad job letting you know, like, 'Hey, this opportunity is happening, and you might be a suitable candidate for application,' then it's not getting picked."
"I don't think the decision was being made at the gubernatorial level that they were going to lean away from rural areas,” she added. “My guess is that it would have more to do with who's making the requests."
Though there wasn’t a substantial increase, the rural tracts in OZ 2.0 will offer investors significantly better incentives.
Investors in a qualified rural opportunity fund who hold an investment for five years will be eligible for a 30% step-up in basis, reducing the gain they will eventually owe tax on when the deferral period ends. Investors in a standard OZ fund still get 10%.
"By increasing the benefits, it offsets an investor's perception that it's an increase in risk," said America First Policy Institute Director Jill Homan, who has invested in opportunity zones.
Rural zones also benefit from a 50% substantial improvement threshold, which means an investor is required to improve a property by half of its initial adjusted basis — excluding the land price — to qualify for OZ benefits. In nonrural tracts, the improvement threshold is 100%.
"That can make improvement of buildings that are in use pretty reasonable," Parker said. "There's a lot of buildings out there that need improvement and could benefit from this."
Fewer Tracts In Large Urban Cores
As for the nonrural zones, major downtown areas made up a smaller percentage of designated zones than in the program’s first iteration, while secondary cities and communities on the edge of metropolitan areas captured a bigger piece of the pie.

Most of the investment that poured into the first iteration of opportunity zones flowed into urban cores, which tend to have the biggest development projects and are viewed as lower-risk.
"The 1.0 market concentrated where institutional capital was most comfortable: big-city cores," Kern Mennone wrote in her analysis. "In 2.0, designated core-city tracts are scarce. That should raise their value to sponsors with urban pipelines and push more deal flow to metro edges and secondary markets that saw little OZ capital the first time."
Her analysis provided examples of metropolitan areas that show this trend. In Erie County, which is home to New York's second-largest city, Buffalo, only 10 of its 83 eligible census tracts were designated. Niagara County, directly north of Buffalo, had 13 of its 22 eligible tracts designated.
Similarly, St. Louis had only 10 of its 66 eligible tracts designated, while adjacent St. Clair County in Illinois saw 12 of its 27 eligible tracts designated.
There were several exceptions to this trend, including Manhattan, which had 42% of its eligible tracts designated, as New York City claimed nearly half of the state’s zones.
College towns also benefited from the spread, including Lubbock and Brazos County in Texas, as well as Kalamazoo, Michigan, and Greene, Missouri.
"We count the students as though they are part of the population," Kern Mennone said. "The census information certainly factors into the college communities. Also, we know a majority of the program was used for housing in 1.0, and housing is usually a significant problem in college communities."
Now that the maps have been made official, opportunity zone investors and developers will begin scouring them for the next investment targets. And AFPI's Homan said it's now up to state and local officials to begin marketing projects in their OZ tracts to attract investors.
"We have to shift from designation to execution," Homan said. "I think that's where there's tremendous opportunity for local and state governments and everybody in between to shine a light on their projects that need investment."
Sasha Jones contributed reporting.